Many More Fevers than COVID-19 Tests
In the week ending March 21, 2020
the USA had three times as many doctor visits with 100F and cough or sore
throat, as past flu seasons: 590,000 patients. This was 390,000 more than the
200,000-patient average for the same week in past flu seasons. And these doctor
visits exclude other people who stayed home with fevers, which may be more
common now that people hesitate to go to a doctor's office.
https://covidtracking.com/data/
At that date, 3/21, the US
had tested 180,000 people and 13% had COVID-19. We can estimate about 200,000
out of the 590,000, or 34%, had flu, reflecting the prevalence of flu in the
past.
1.
Who are all the
other new fever patients going to doctors?
2.
Are the test
results representative of all fever patients?
3.
Are test results
biased toward healthy outcomes if they are given to health care workers, healthy
contacts of sick people and VIPs?
New York had 63,000 more
fever cases in the week ending 3/21 than previous years. New Jersey had 52,000
more, California and Texas 44,000 each, Pennsylvania 18,000. Virginia and
Maryland had 14,000 and 11,000 more. Other states are in the table below. CDC
updates data on fevers every Friday.
https://www.cdc.gov/flu/weekly/index.htm#ILINet
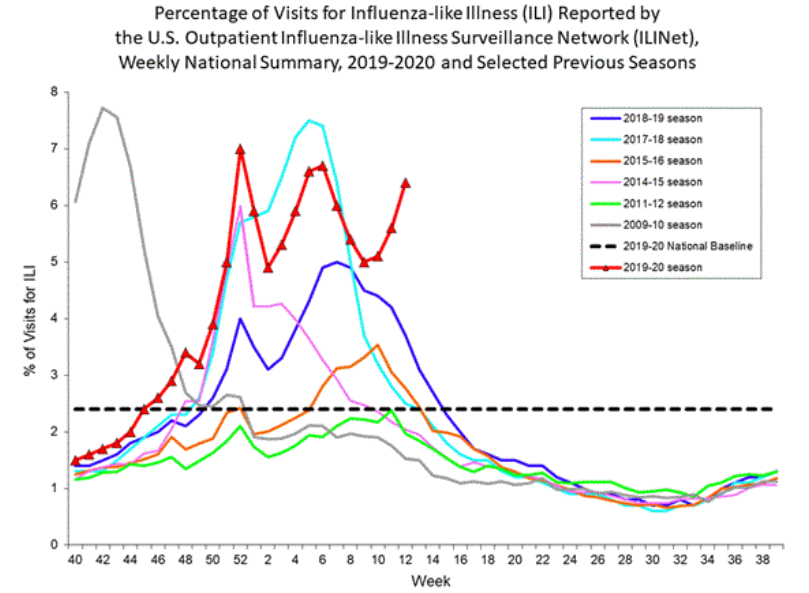
The numbers of fever patients are based on a CDC sample which shows what percentage of outpatient doctor visits have 100F fever with cough or sore throat. CDC calls it "influenza-like illness" (ILI). They release the data for each state for each week 2010-2020. I ignored states where fewer than 20 doctors reported on their patients, such as DC, but the national total includes all states, properly weighted.
https://gis.cdc.gov/grasp/fluview/fluportaldashboard.html
CDC also reports the total
primary care doctor visits in many states, and I estimated visits in other
states to apply this CDC percentage,
https://www.cdc.gov/nchs/data/ahcd/namcs_summary/2015_namcs_web_tables.pdf
https://www.cdc.gov/nchs/fastats/physician-visits.htm
"Influenza-Like
Illness" (ILI)
Outpatient Visits with 100F Fever and Cough or Sore Throat
|
A |
B |
C |
D |
E |
F |
|
Week Ended 3/21/2020 |
ILI: Extra Doctor Visits This Week, (D minus E) times (F) |
Extra ILI Doctor Visits per 1,000 Population |
ILI as % of Doctor Visits This Year |
Average ILI %, This Week in 2010-2019 |
|
|
United States |
388,700 |
1.1 |
6.4 |
2.2 |
9,177,144 |
|
Alabama |
400 |
0.1 |
6.7 |
3.8 |
13,201 |
|
Arizona |
0 |
0.0 |
2.2 |
2.2 |
206,675 |
|
California |
44,600 |
1.1 |
5.5 |
2.9 |
1,675,589 |
|
Colorado |
800 |
0.1 |
6.9 |
1.6 |
15,504 |
|
Connecticut |
500 |
0.1 |
7.0 |
2.2 |
9,599 |
|
Georgia |
13,400 |
1.3 |
9.1 |
2.5 |
202,780 |
|
Illinois |
13,600 |
1.1 |
7.1 |
2.7 |
308,465 |
|
Kansas |
400 |
0.1 |
7.2 |
2.3 |
7,844 |
|
Kentucky |
400 |
0.1 |
6.0 |
2.2 |
12,028 |
|
Louisiana |
1,300 |
0.3 |
13.5 |
3.1 |
12,516 |
|
Maine |
200 |
0.1 |
6.8 |
1.3 |
3,619 |
|
Maryland |
1,000 |
0.2 |
8.5 |
2.1 |
16,277 |
|
Massachusetts |
9,200 |
1.3 |
6.7 |
1.7 |
182,260 |
|
Michigan |
3,200 |
0.3 |
3.5 |
2.1 |
227,153 |
|
Mississippi |
200 |
0.1 |
6.0 |
3.5 |
8,013 |
|
Montana |
100 |
0.1 |
4.6 |
0.7 |
2,877 |
|
Nebraska |
200 |
0.1 |
6.4 |
2.0 |
5,208 |
|
New Jersey |
51,500 |
5.8 |
13.4 |
3.0 |
493,051 |
|
New Mexico |
200 |
0.1 |
5.8 |
2.7 |
5,645 |
|
New York |
63,300 |
3.3 |
8.0 |
2.4 |
754,557 |
|
New York City |
incl in state |
12.2 |
2.4 |
incl. in state |
|
|
North Carolina |
6,500 |
0.6 |
5.2 |
2.2 |
215,294 |
|
Ohio |
6,000 |
0.5 |
3.3 |
1.4 |
319,015 |
|
Oklahoma |
500 |
0.1 |
8.4 |
3.7 |
10,653 |
|
Oregon |
600 |
0.1 |
6.8 |
1.9 |
11,355 |
|
Pennsylvania |
17,800 |
1.4 |
6.6 |
2.2 |
400,015 |
|
South Carolina |
1,000 |
0.2 |
9.8 |
2.3 |
13,862 |
|
South Dakota |
0 |
0.0 |
2.9 |
1.8 |
2,382 |
|
Tennessee |
1,000 |
0.1 |
7.6 |
2.0 |
18,386 |
|
Texas |
44,300 |
1.5 |
8.1 |
3.6 |
973,288 |
|
Utah |
400 |
0.1 |
6.3 |
2.0 |
8,631 |
|
Virginia |
14,400 |
1.7 |
7.4 |
2.8 |
315,827 |
|
Washington |
9,200 |
1.2 |
6.1 |
1.6 |
203,310 |
|
West Virginia |
200 |
0.1 |
5.3 |
1.8 |
4,825 |
|
Wisconsin |
700 |
0.1 |
6.3 |
2.1 |
15,676 |
Estimates based on sample survey. Does not show states separately if this week's sample covered patients from less than 20 doctors, but all states are included in US total,
Percents from https://gis.cdc.gov/grasp/fluview/fluportaldashboard.html